
The most important thing is to have a plan.
Timing is tough, so valuation and signposts are helpful.
As a benchmark, I use the S&P 500, I’m focused on the US, where I know stuff about the financial system and market function, and evaluate opportunities relative to that.
Previously, I put together a downside scenario worksheet, with pluggable items, so it can be easily manipulated for modified assumptions.
What was missing was an upside scenario, for once we clear this situation, in order to evaluate risk/reward on the benchmark. Previously, I’ve focused on investment opportunities with a 3x reward/risk ratio. I can gain 3x more than I risk, if I’m right. That’s merely one way to look at things.
I’ve now done a bit more work.

First, I’ve adjusted some of the core data to refresh with current and historical Bloomberg data, and most importantly, an ‘Index Weighted EPS estimate’. This also requires adjustment to the trailing EPS data, since these are not on the same basis. To do that I looked at the ratios and adjusted with a 1 yr back-window average of those ratios.
The upshot is some of the figures like P/E ratios are going to be nominally different from prior scenario sheets. But since ultimately I am looking at spreads like risk premium, that should wash out.
Second, I’ve grabbed an estimate out there of GDP declines of 5-8% annualized and a possible 30% decline in earnings. This seems pretty draconian. However, when I checked historical outcomes (still limited to the period 2000+, a big caveat), it turns out, this isn’t unreasonable, as I’ll show.
One upshot is this. As of yesterday’s close, given the really bad EPS decline scenario, the SPX was merely ‘fairly valued’ for a post-crisis recovery. So, as I advised a friend, I was not planning to buy the benchmark with substantial downside and merely at a fair value upside.
I followed the same principle to get an objective measure of upside potential – a naive lookback over the last 20 years.
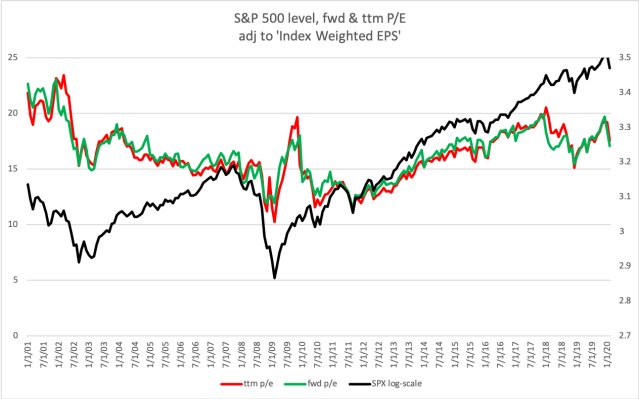
Here is the historical behavior of the simple S&P 500 index vs. its forward and trailing 1 yr P/Es, with the index level on a log scale (RHS):
Next, let’s take a look at how the risk premium I’ve discussed has behaved:

Remember, it’s month end, so you don’t see the extreme for March 2020.
If you eyeball it, you can see where my +3% excursion rule came from.
Just for shits and giggles, lets look at how the market tends to over or under forecast realized equity earnings yields 1 year forward (we take a 1 year look back at fwd P/E):
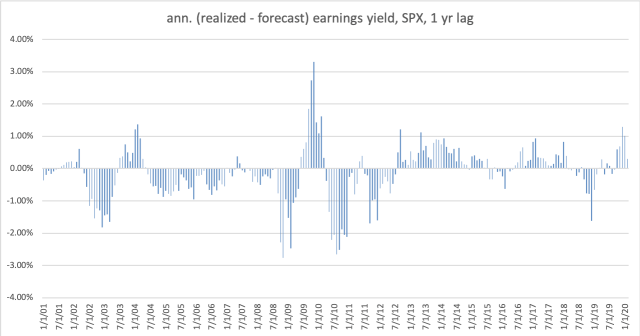
A very nice cyclical behavior. I’ve decided that given an overriding EPS forecast, I’m going to ignore this because I think it would be double-counting. Just keep it in mind.
Here’s an important series to gauge whether certain negative or positive forecasts forward for earnings behavior are conceivable:

From this, I concluded
- the negative forecasts i’ve seen for -5-8% GDP and -30% earnings are not out of the question
- a rebound off the bottom of +25% earnings seems reasonable, given a sharp recession
For good measure, I’ve started to factor in signals from gold, and deflating earnings with gold. I’ll have more on that in the future. In the meantime, here’s a look at gold-deflated SPX P/E behavior and the SPX/Gold ratio:


Signposts:
We got
- JPM and others to the discount window
- CPFF re-established
- PDCF with ridiculous collateral qualifications, including CLOs, CDOs and closet buying of equities!
We still don’t see
- Utilization of the Central Bank swap lines
- Effective implementation of fiscal actions (just announcements, meetings at this point)
- Indications of USD shortage easing (FRA/OIS, etc)
